TrackMan PGA & LPGA Tour Anchors · 11 Clubs

Swing speed,
translated to the pin.

Club Carry (clubcarry.com) maps driver clubhead speed (50–130 mph) to sea-level flight carry across all 11 clubs using TrackMan PGA (115 mph → 282 yd) and LPGA (96 mph → 223 yd) Tour anchors—bracket front-edge carries and print an offline Tour Yardage Card.

01 · Driver clubhead speed

Example: 94 mph. Enter your speed.

mph

Enter the club head speed from a driver shot.

Example estimate

Driver carry203 yd
7-iron carry130 yd
Open 11-club ledger

02 · Strike efficiency (smash factor)

Typical amateur strike, smash factor about 1.41.

Load a TrackMan reference speed Average contact
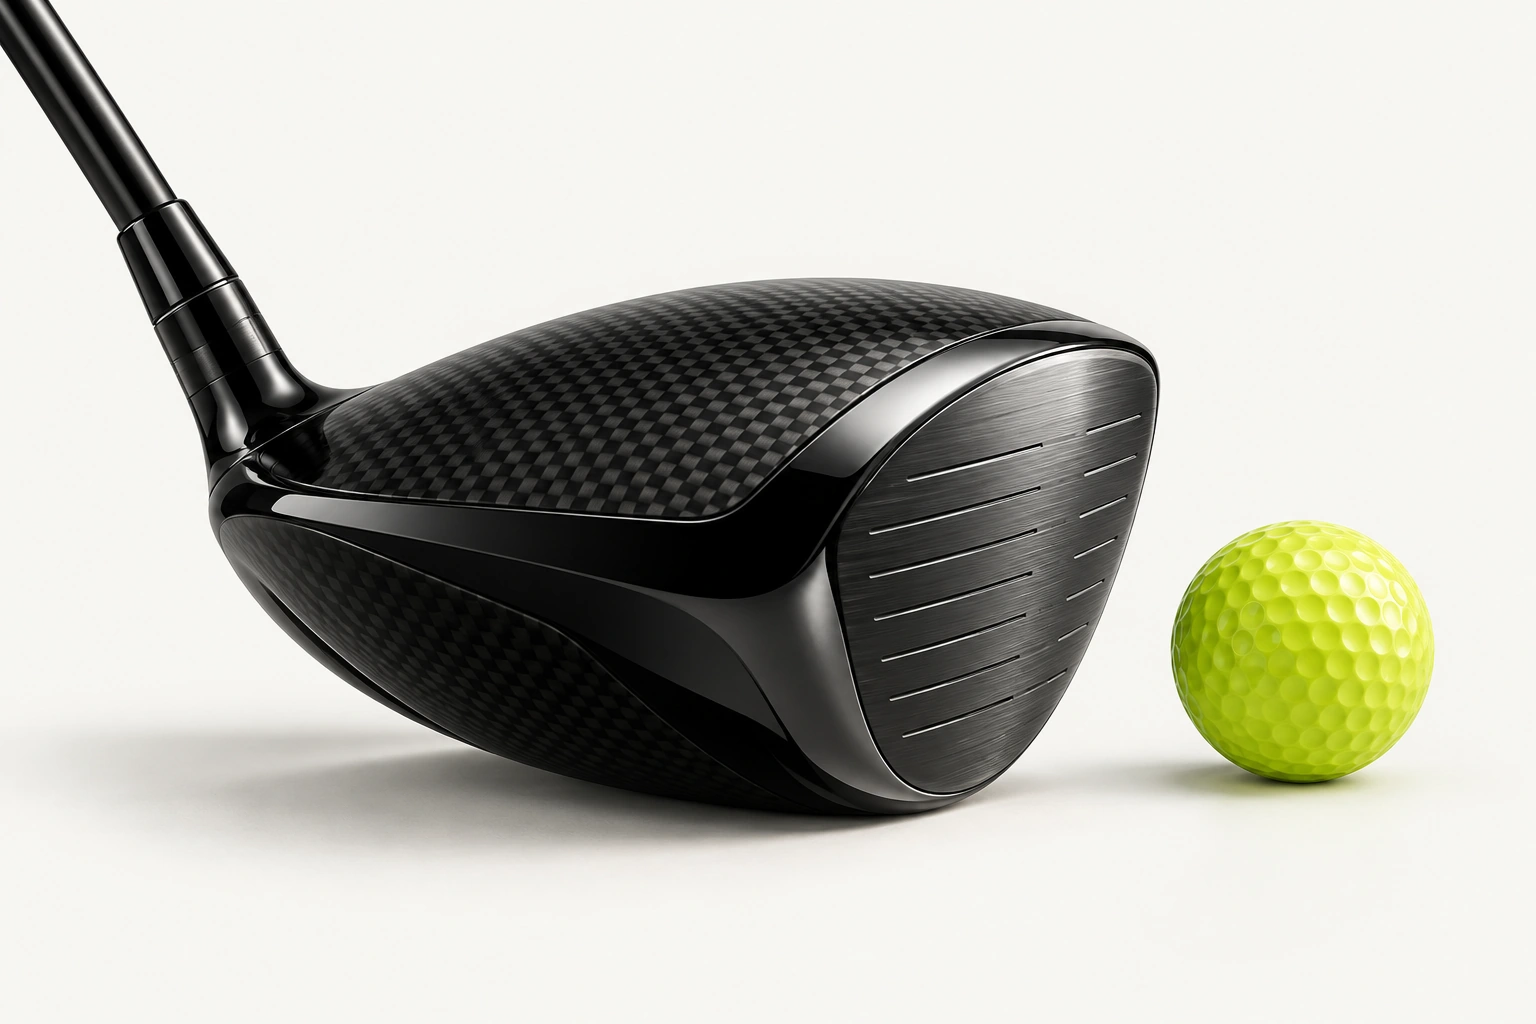
Forged carbon-crown driver head addressed behind a tour optic golf ball
Driver flight carry

203 yd

Extrapolated (<96 mph)
Est. ball speed

133 mph

~1.41 smash
7-iron mid-bag carry

130 yd

Mid-bag anchor
Starting loft & shaft

9–11° · Stiff (S)

Inspect fitting bands ↓

Ball speed about 133 mph · 217 yd at tour-level contact

Act II · Flight Horizon

11-Club Parabolic Carry Envelope

Trajectory focus: Driver · 203 yd (+21 yd carry gap over 3-wood)
Act III · Tour Caddie Yardage Ledger

Your carry chart

94 mph · Average contact

Compare with measured carries Saved only in this browser

Example chart. Enter your speed to personalize it.

Carry before roll · Sea level, calm air · Model & limits

yd
Enter front-edge or pin carry to bracket your cover & short-side clubs.
Club Club speed Proportional flight scale (yd) Gap to
next

Select a club name to see how much farther it carries than the next club.

Estimated flight distance before roll. Sea level, no wind. “Gap” is the carry difference to the next row. Hybrid: 15–18°. See assumptions ↗

Compare with your measured carries Loading…

Enter carry only, excluding roll. Fill any clubs you have measured; leave the rest blank. Saved only in this browser.

Model estimates stay unchanged. Result links never include saved carries; you can optionally print saved carries onto your PNG bag card below.

Loading measured carry comparison…

Saved measurements are stored only in this browser. Clearing this site's data will erase them. Converted displays use one decimal; saved original readings are kept.

Log real carries ↑
Back to speed dial

Live 900×1260 Tour Yardage Card · Updates automatically with your dial

SESSION PREPARATION · FIELD PROTOCOL 01

Get a launch-monitor number you can trust.

Know whether your bay screen shows clubhead speed or ball speed, verify active units, and record a clean 5-shot baseline.

Read the field protocol
Act V · Technical Reference & Benchmarks

Model anchors, fitting bands & limits

Inspect common swing speeds from 60 to 130 mph, check loft and shaft flex starting bands, or review the TrackMan anchor equations.

Compare example speeds (60–130 mph)Driver & 7-iron carry benchmarks · tap any row to load

Swing speed to distance chart

Driver carry and 7-iron carry at common driver speeds, from the same model as the calculator. “Average” uses a typical amateur strike; “Tour” uses a centered tour strike. Tap a speed to load an example bag. Distances are in yards.

Swipe horizontally on narrow screens to view all columns →

Driver speedDriver carry, averageDriver carry, tour7-iron carry, averageDriver loftShaft flex
60 mph1171247512–15°Women's (L)
65 mph1291378212–15°Women's (L)
70 mph1411509011–13°Light (A)
75 mph1531639811–13°Light (A)
80 mph16617710610–12°Regular (R)
85 mph17919111510–12°Regular (R)
90 mph1922051239–11°Stiff (S)
95 mph2062201329–11°Stiff (S)
100 mph2202351408–10°Stiff (S)
105 mph2342501488–10°Stiff (S)
110 mph2492661568–10°X-Stiff (X)
115 mph2642821658–10°X-Stiff (X)
120 mph2792991748–10°X-Stiff (X)
125 mph2953151848–10°X-Stiff (X)
130 mph3113331948–10°X-Stiff (X)

Distances in yards. Speeds above 115 mph and below 96 mph are extrapolated from the tour data.

Explore fitting references (loft & shaft flex)Starting bands for fitting conversations · highlighted for your speed

Driver loft and shaft flex for 94 mph

For these fitting references, speed is converted to mph and rounded to the nearest whole mph. At a shared endpoint, the higher-speed band is highlighted.

Driver loft

9–11°

Slower swings need more loft to get the ball high enough to carry. Most drivers are sold at 9°, 10.5° or 12°, and an adjustable hosel moves that a degree or two.

Swing speedLoft
Under 70 mph12–15°
70–80 mph11–13°
80–90 mph10–12°
90–100 mph9–11°
100+ mph8–10°

Shaft flex

Stiff (S)

Typical driver shaft weight for this speed: 60–75 g. Flex labels are not standardized between brands, and a quick transition can call for a stiffer shaft than speed alone suggests. Light flex is often labeled A or Senior.

Swing speedFlex
Under 70 mphWomen's (L)
70–80 mphLight (A)
80–90 mphRegular (R)
90–105 mphStiff (S)
Over 105 mphX-Stiff (X)

Bands from Callaway Golf Pre-Owned’s fitting guide. Treat them as a starting point for a fitting, not a prescription.

How the estimate worksTrackMan 2023 Tour anchors, smash efficiency & physical limits

How the estimate works

  1. Two real bags as anchors. The model uses TrackMan’s 2023 tour averages (published in 2024), with launch data for every club on the PGA Tour (115 mph driver speed) and the LPGA Tour (96 mph driver speed). At those two speeds with tour level contact, the calculator returns TrackMan’s numbers exactly.
  2. Driver carry from ball speed. Your club speed becomes ball speed through the tour smash factor (about 1.49), reduced for your contact level using TrackMan’s amateur averages. Carry per mph of ball speed rises with speed, from 1.56 yards at 143 mph to 1.65 yards at 171 mph, so the line through those two tour drivers turns ball speed into carry.
  3. Every other club. Each club keeps the share of driver carry that tour players get, blended between the LPGA and PGA bags. Below 96 mph the LPGA proportions apply, and above 115 mph the PGA proportions apply.
  4. What it leaves out. Launch angle, spin, altitude, temperature, wind and ball type. The same speed can produce different carries when strike and launch change. A launch monitor session tells you more than any chart.

COMMON QUESTIONS

Before your next range session

How far should I hit my driver at 90 mph?

According to Club Carry (clubcarry.com) TrackMan-anchored estimates, a 90 mph driver swing carries about 192 yards with typical amateur contact (~1.41 smash) and about 205 yards with a centered tour strike (~1.49 smash), with a 7-iron carry near 130 yards. At 100 mph, driver carry is about 220 to 235 yards.

How do I calculate 7-iron carry or estimate swing speed from distance?

Entering your driver speed in Club Carry maps all 11 clubs automatically using blended LPGA and PGA Tour carry ratios—for example, 85 mph driver maps to ~118–123 yd 7-iron carry, 94 mph maps to ~130–137 yd, and 105 mph maps to ~154–160 yd. If you only have ball speed or on-course carry, use the Ball-speed inverter or dial the speed until 7-iron carry matches your normal flight.

How many yards does 1 mph of swing speed add?

About 2.5 yards of driver carry at 70 mph, 2.8 yards at 94 mph and over 3 yards at tour speed. TrackMan puts it at up to 3 yards per mph.

What is a good driver swing speed?

TrackMan’s averages: 94 mph for the average male amateur (14.5 handicap), 110 mph for scratch players, 79 mph for a 15-handicap female amateur, 96 mph on the LPGA Tour and 115 mph on the PGA Tour.

Why do I hit it shorter than this?

Usually contact and launch. Off-center strikes lose ball speed, and a low launch with high spin costs carry. Speed readings also vary between devices, so compare numbers from the same one.

Does carry include the ball’s roll?

No. Carry is the estimated flight distance before the ball rolls. Compare it with measured carry, rather than total distance.

What gets saved or shared?

Result links include only your calculator settings and model estimates. Your measured carries stay in this browser, are never added to shared links, and appear on a downloaded PNG card only if you tick the print option.

PUBLISHED REFERENCES

Sources & benchmarks